Every real invested at work, every debt under control.
Portfolio as a % of CDI, maturities, concentration by bank and the debt map on the same dashboard. Both sides of the balance sheet, with the calculation in the open.
Invest better and borrow cheaper, with the same data.

Measured returns
Every investment as a % of CDI, with the weakest performer highlighted.

Planned liquidity
Maturities and a liquidity ladder, so you know when the portfolio turns into cash.

Debt on the same screen
Average cost, amortizations and covenants right next to the portfolio.
From today's investment to next year's maturity.
Three moments, with the dashboard open
1. Morning: what matures and returns to cash
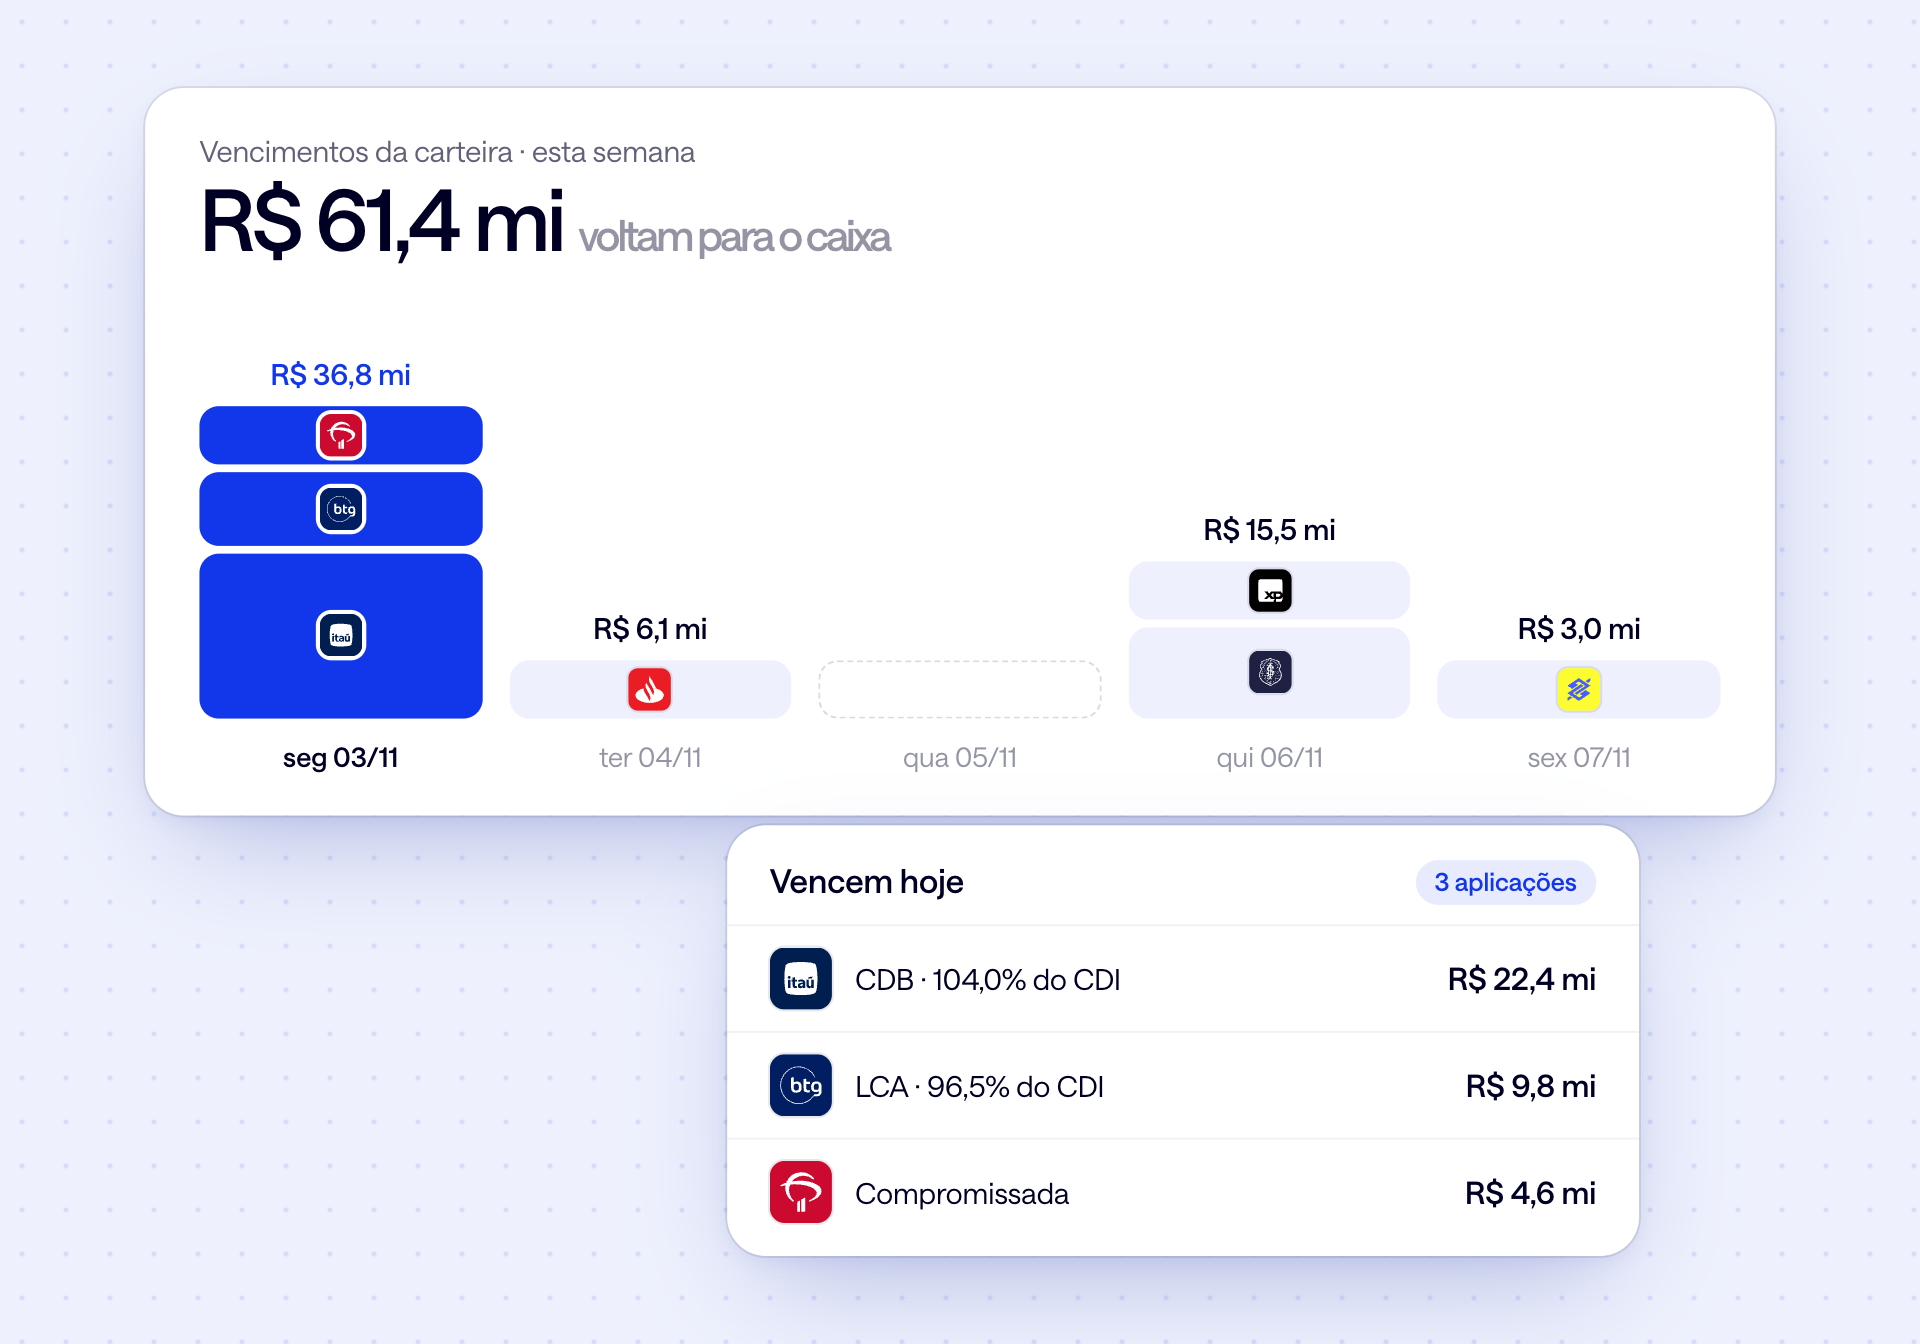
Investments maturing today and this week, with bank, rate and amount. You know how much comes back to cash before deciding where to reinvest.
2. During the day: where it earns more
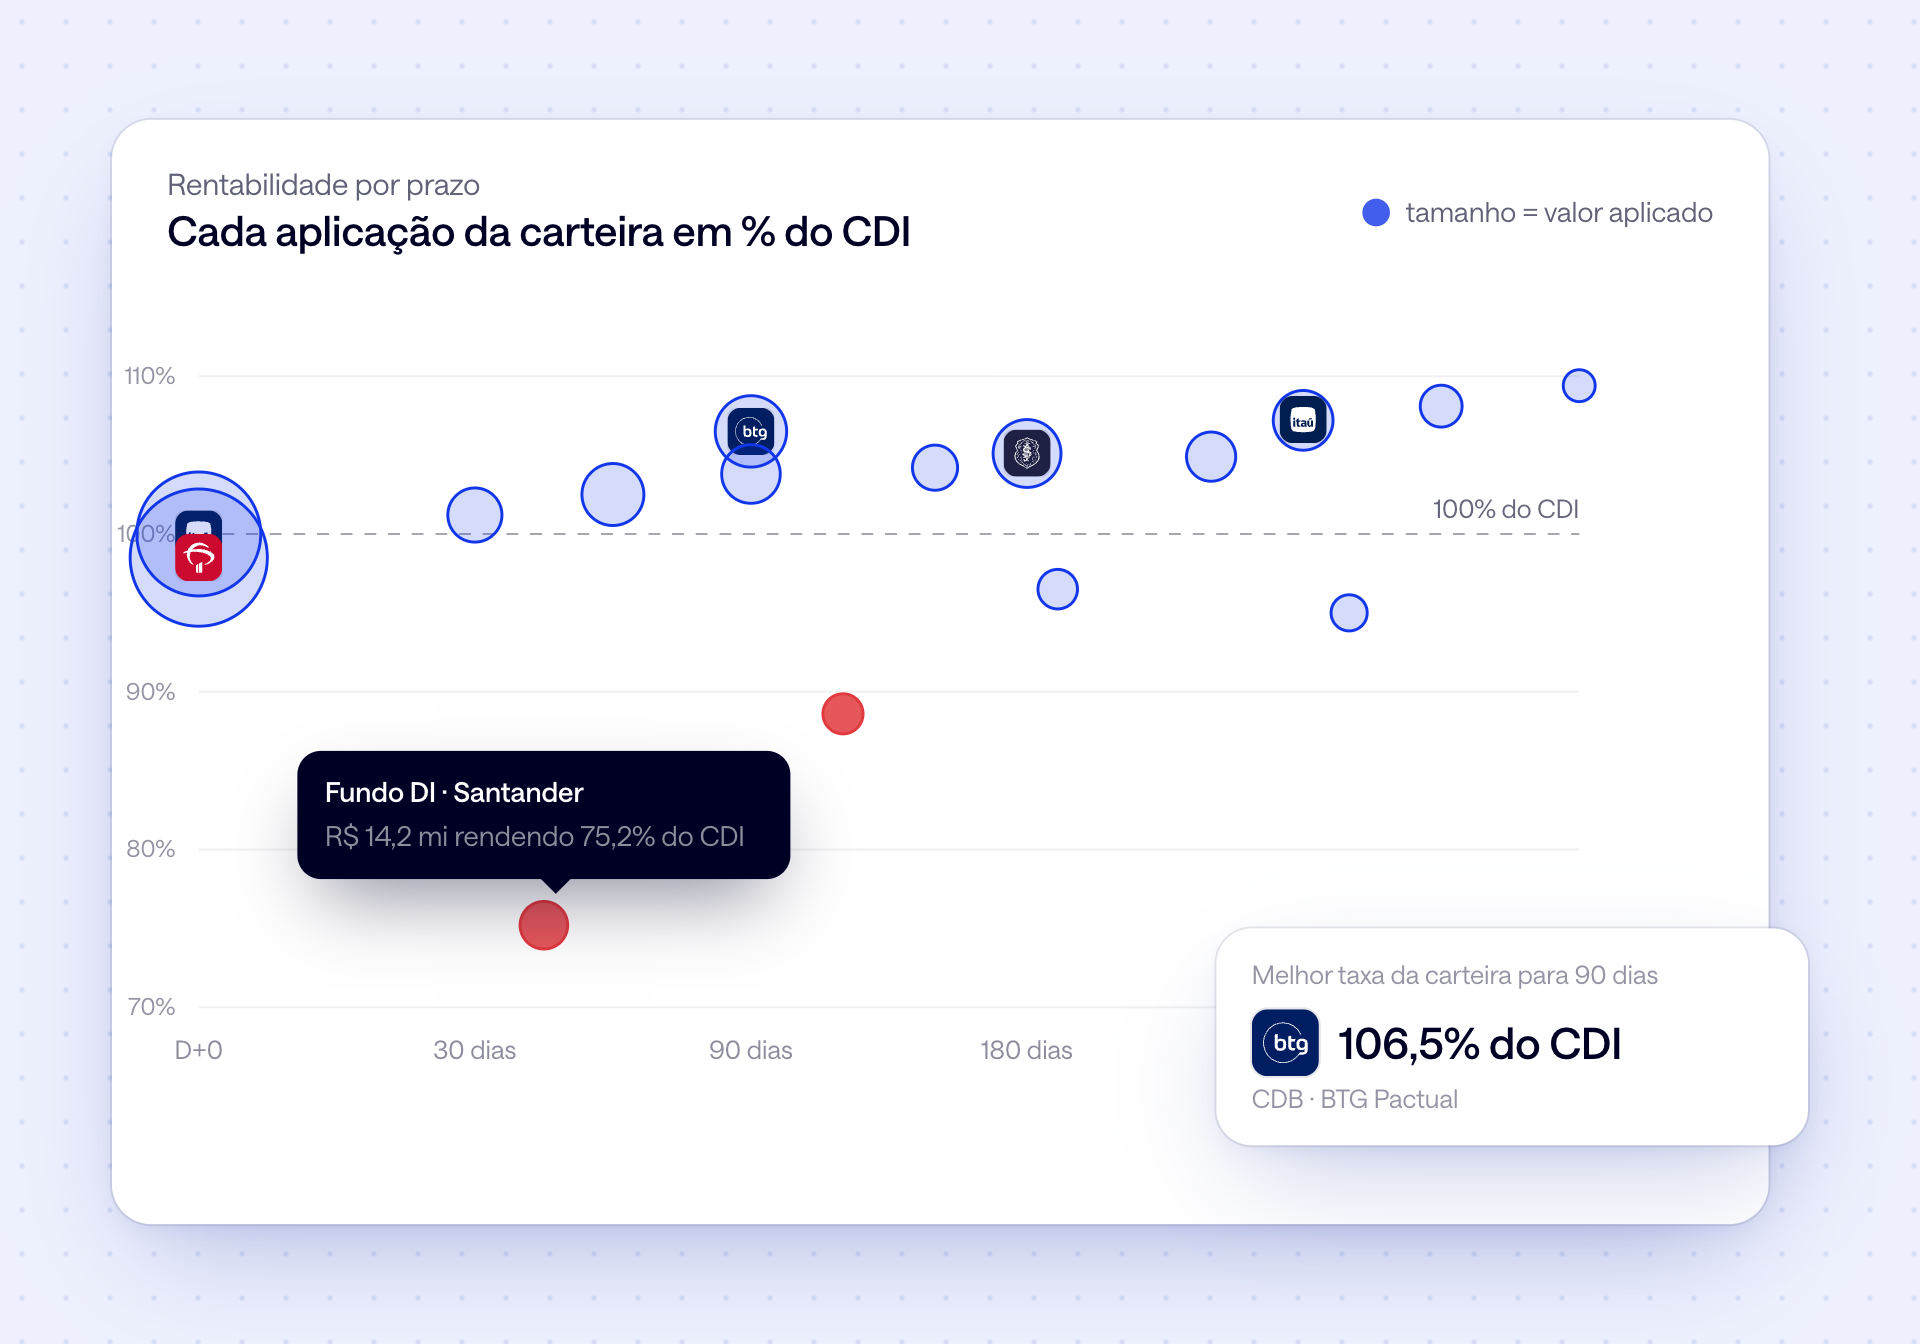
Every investment in the portfolio by term and % of CDI. Anything earning below expectations shows in red, and the best rate for each term is in plain sight.
3. Month-end: raise and renegotiate
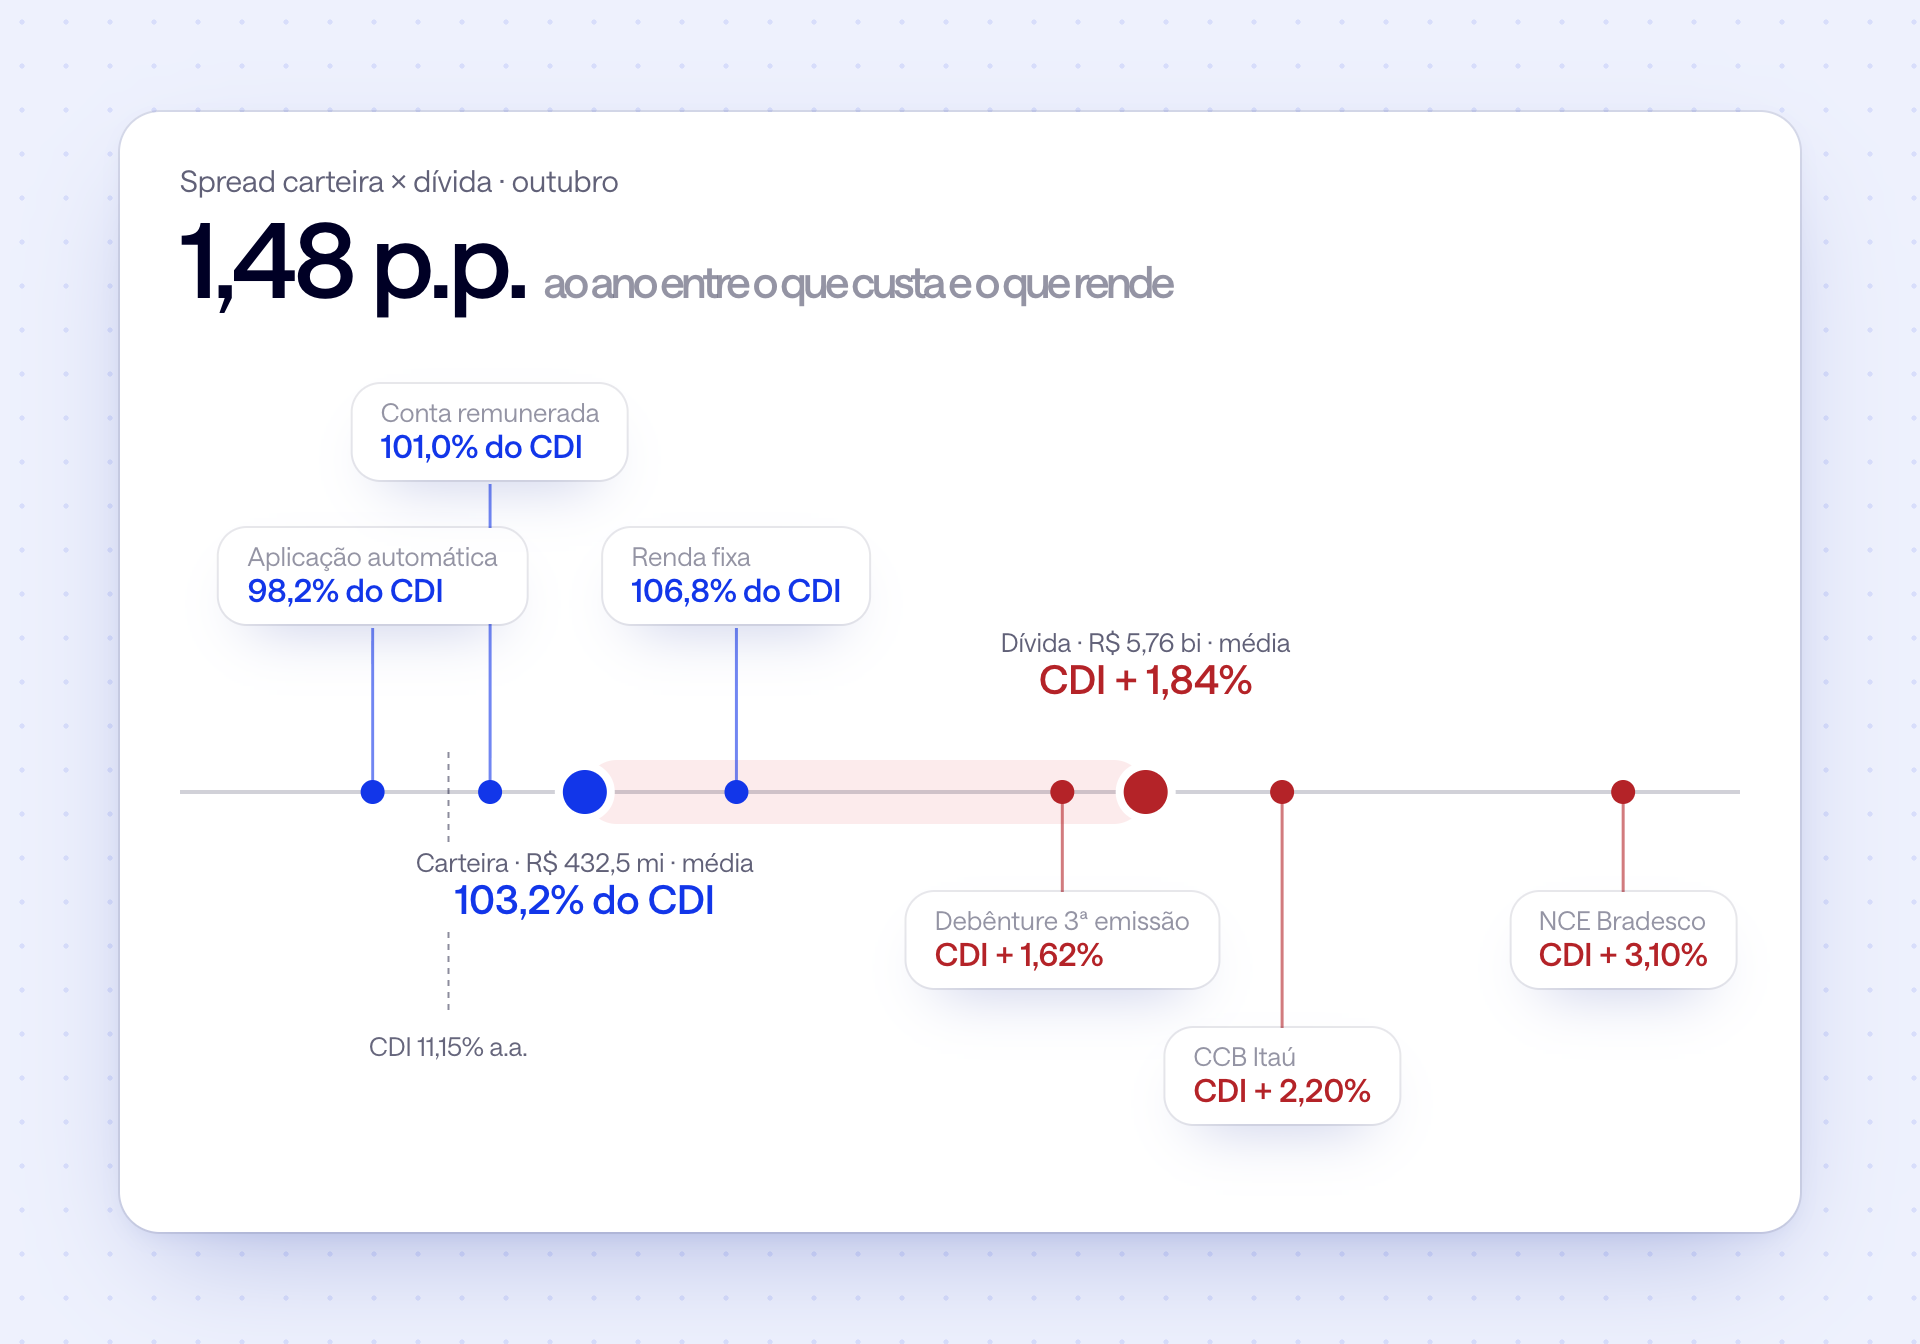
The cost of debt against what the portfolio earns, instrument by instrument. The spread shows where it pays to renegotiate or prepay.
Portfolio and debt, side by side.
Returns, liquidity, concentration, debt and transactions for the whole group.
Your capital dashboard
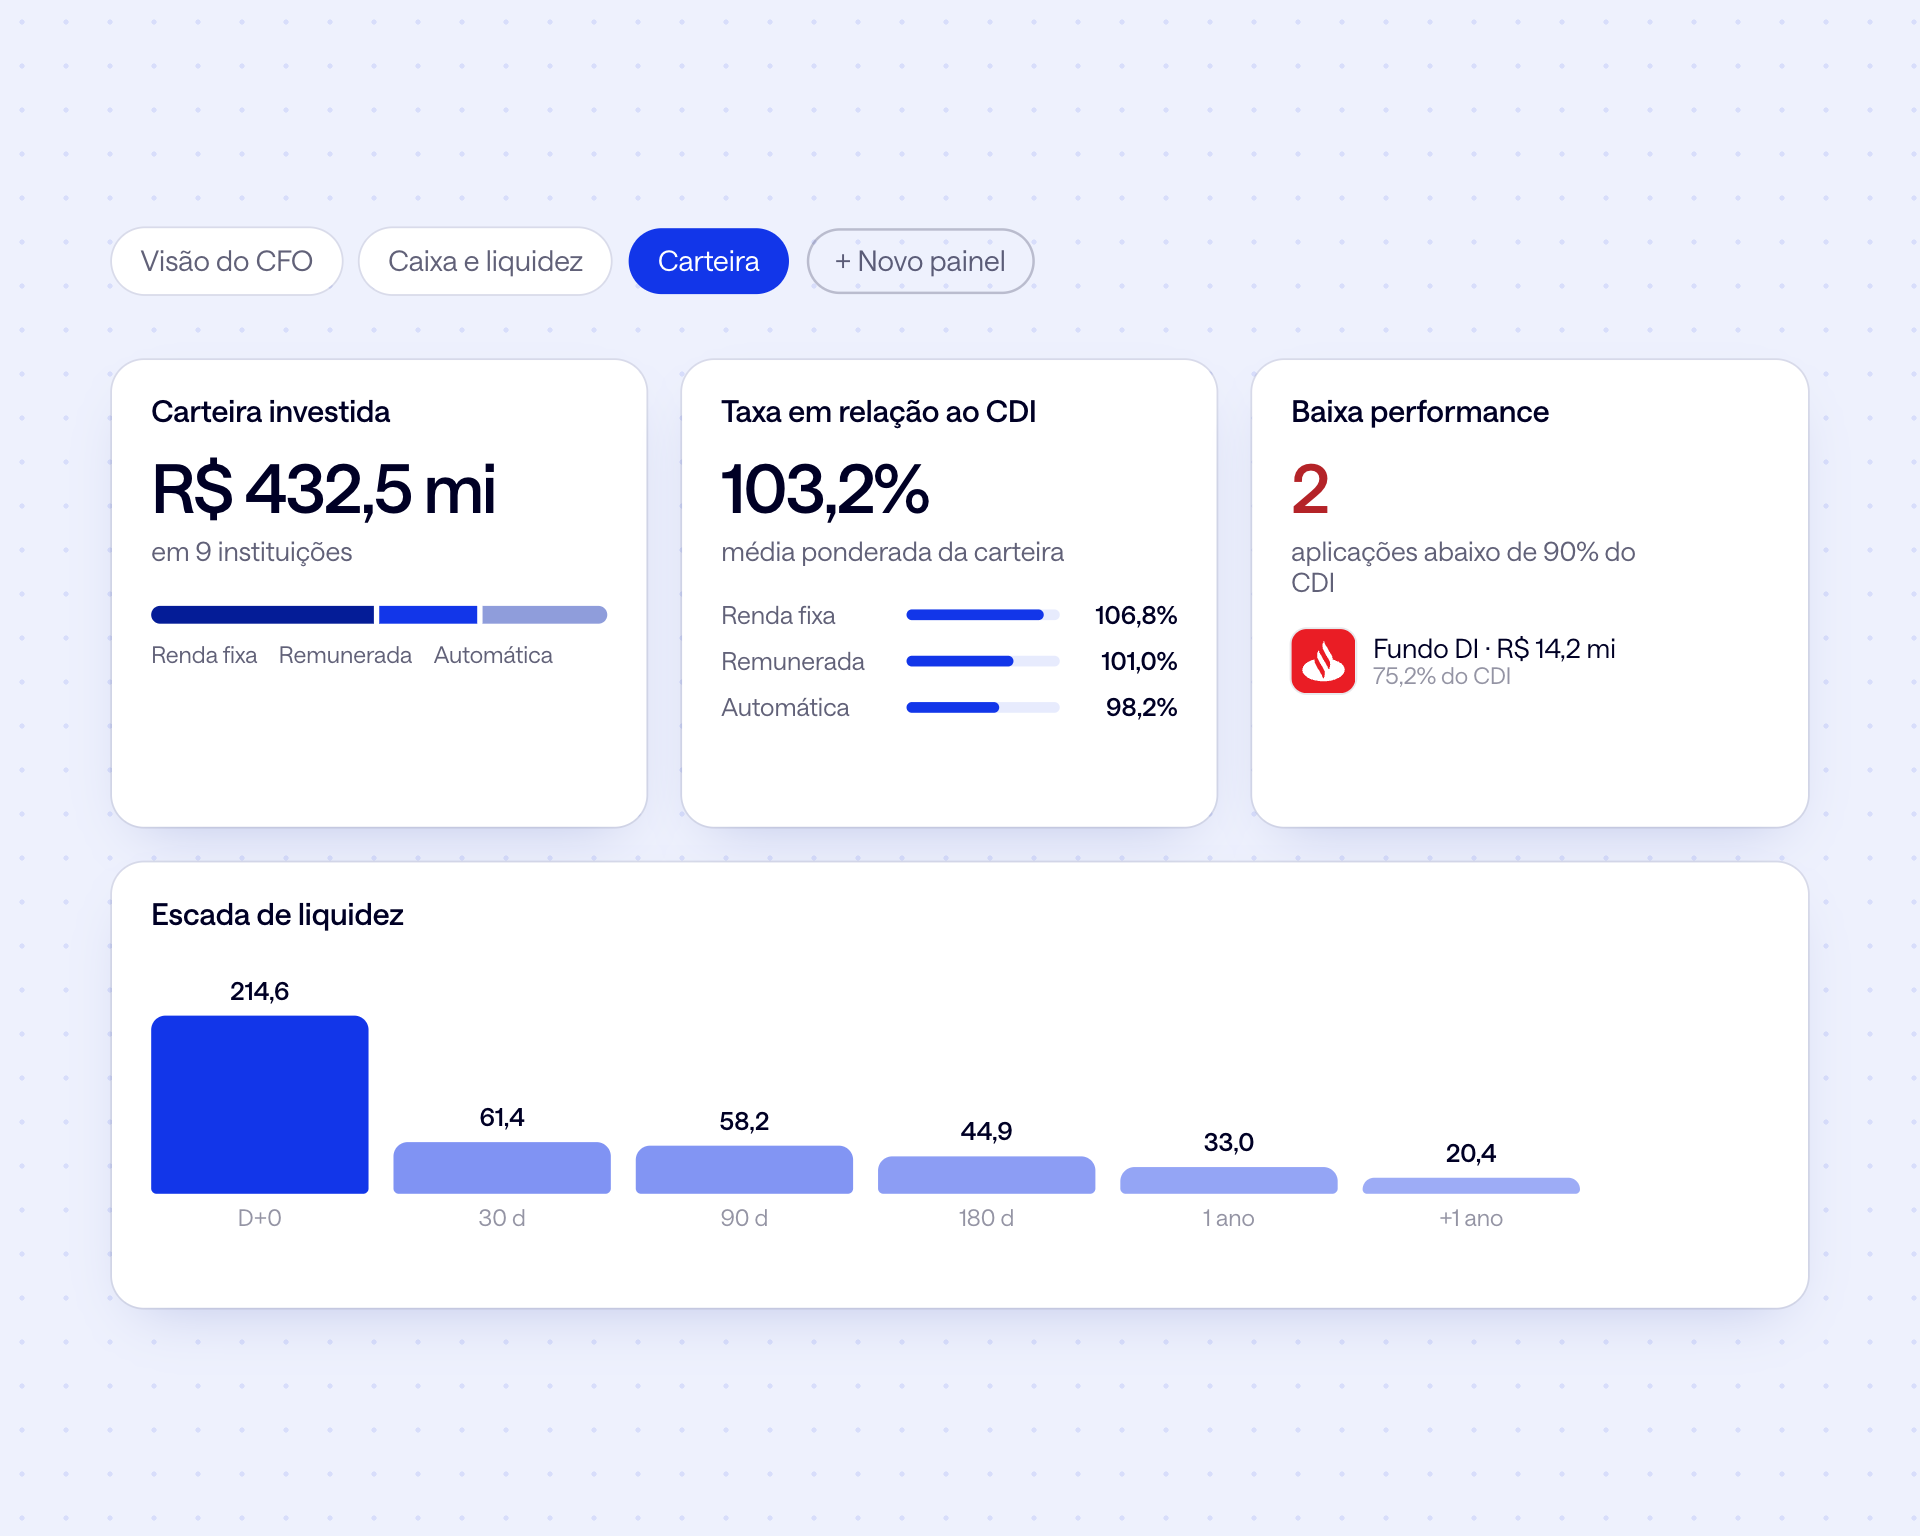
Invested portfolio, rate relative to CDI, underperforming investments and the liquidity ladder on the same dashboard.
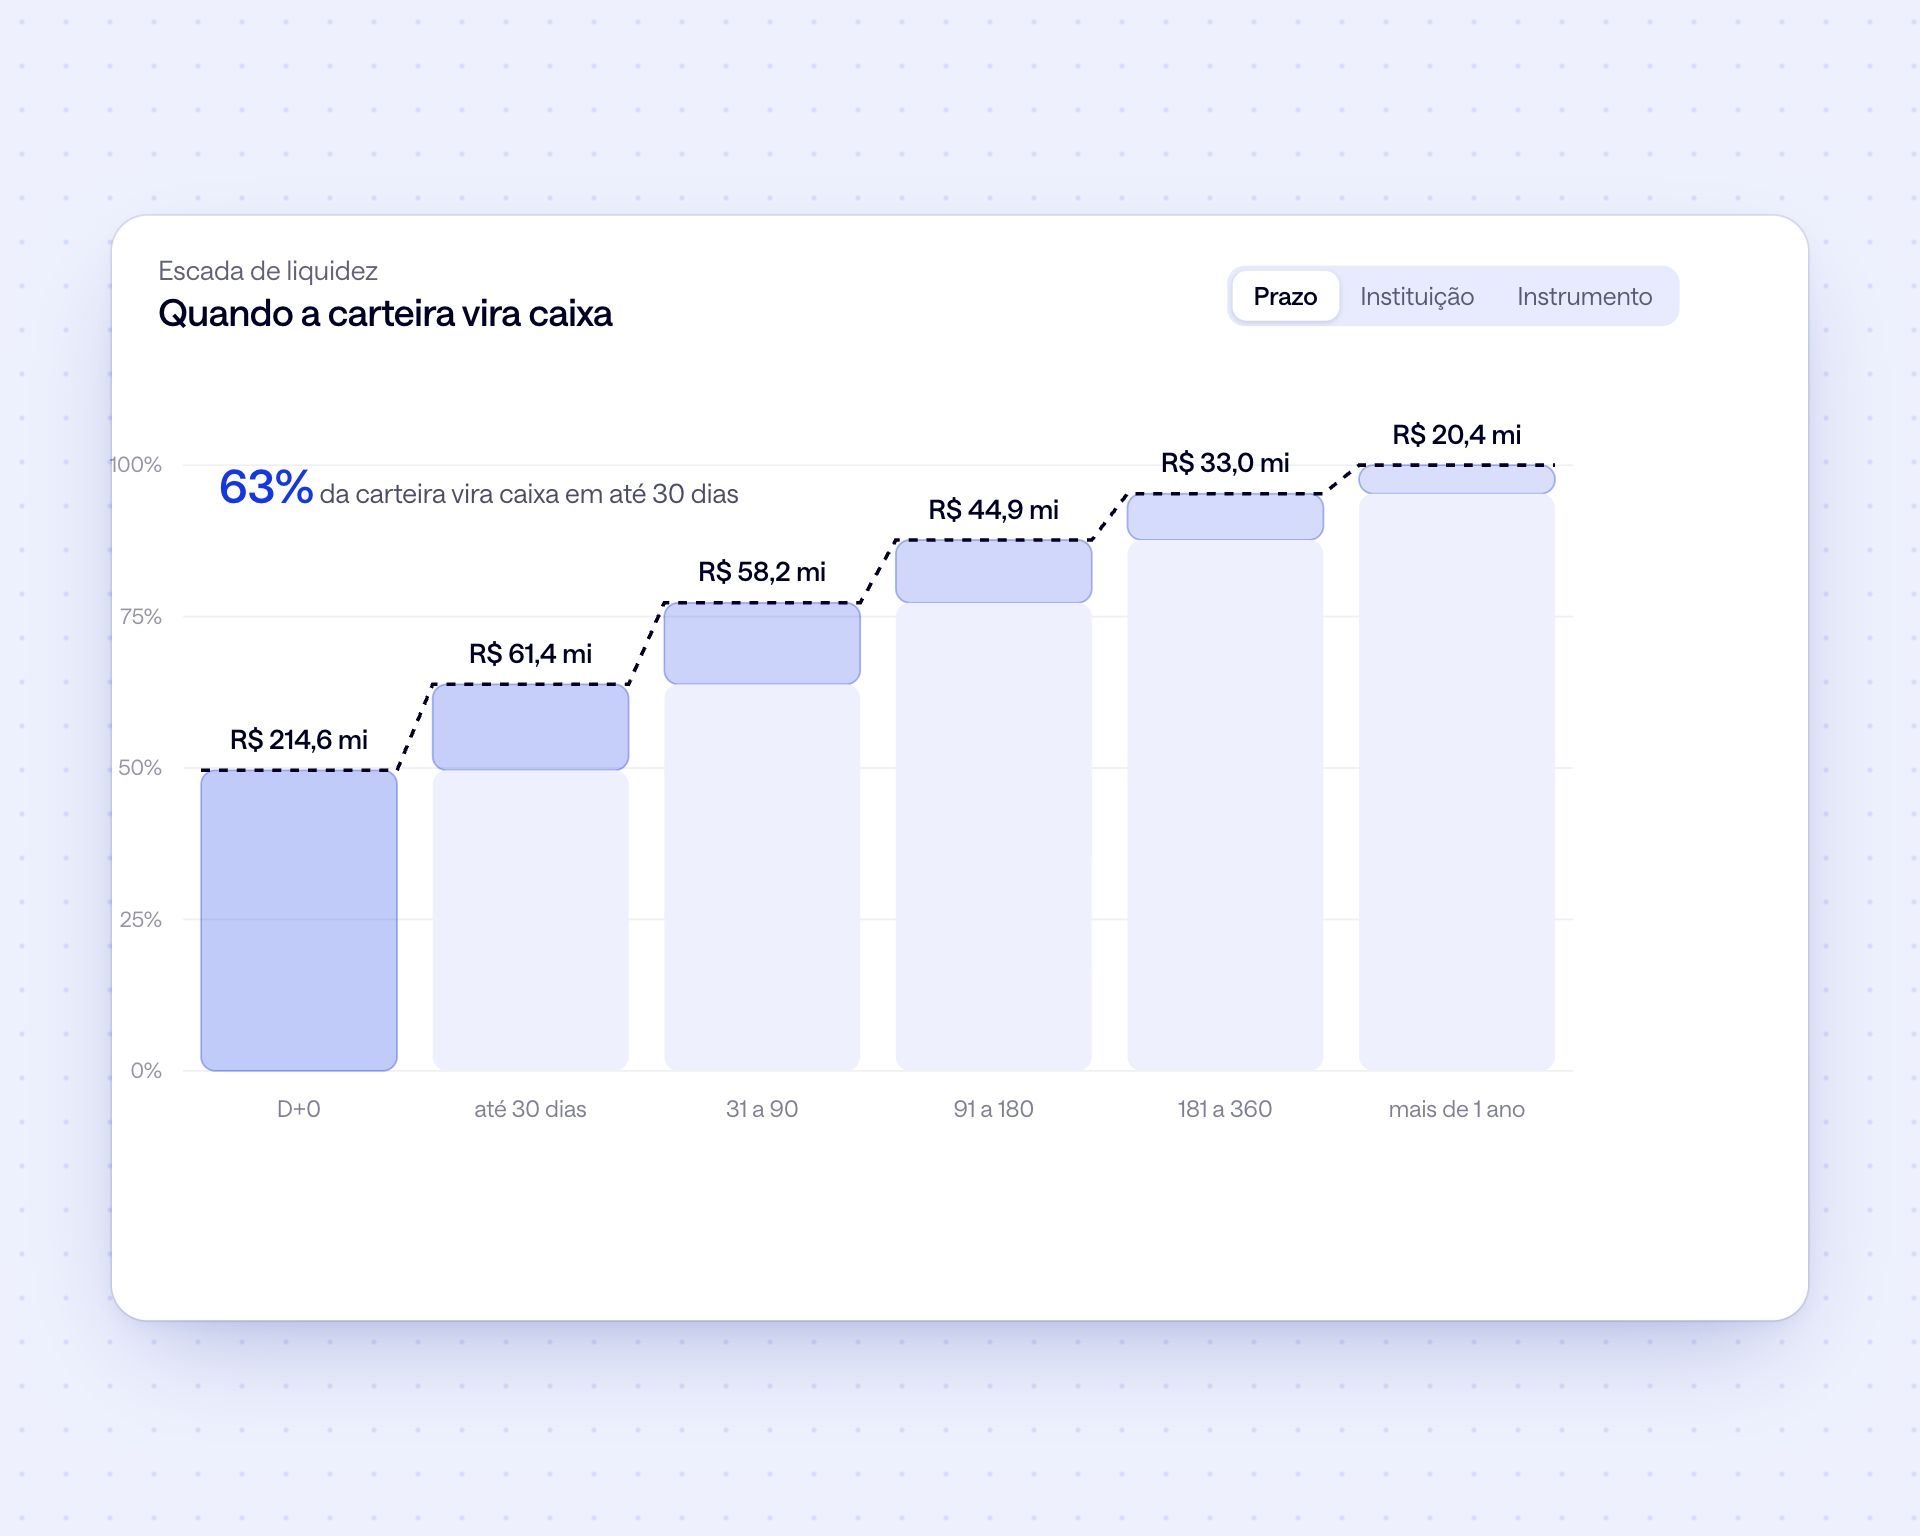
Liquidity ladder
How much of the portfolio returns to cash at D+0, 30, 90, 180 and 360 days, to match maturities with the group's commitments.
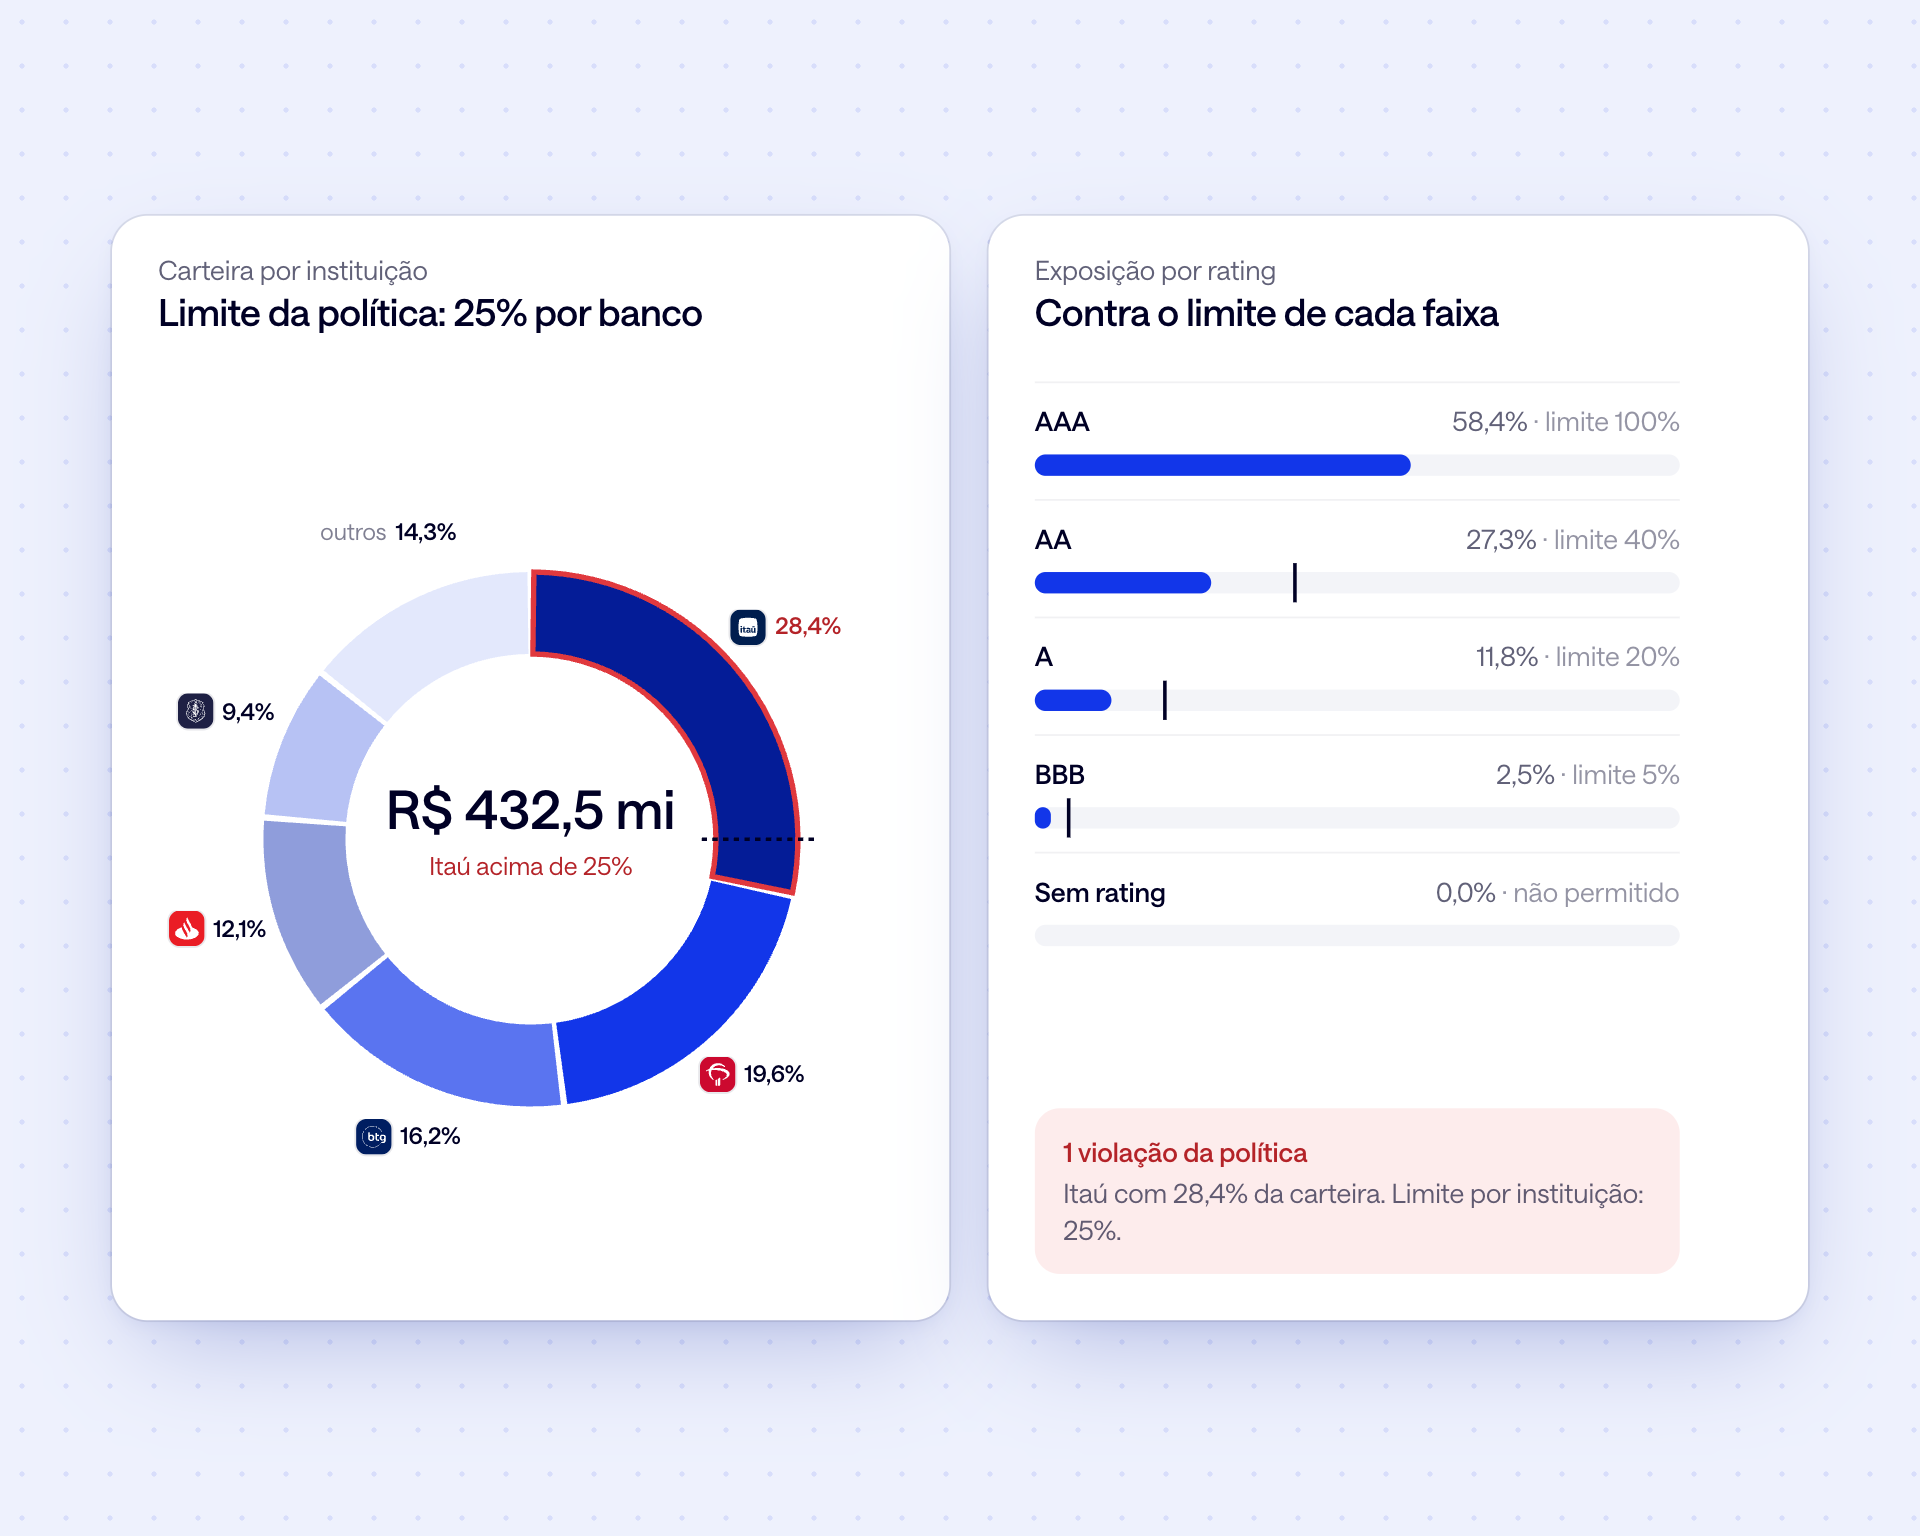
Concentration and rating
Portfolio by institution and exposure by rating band, measured against the limits of your investment policy.
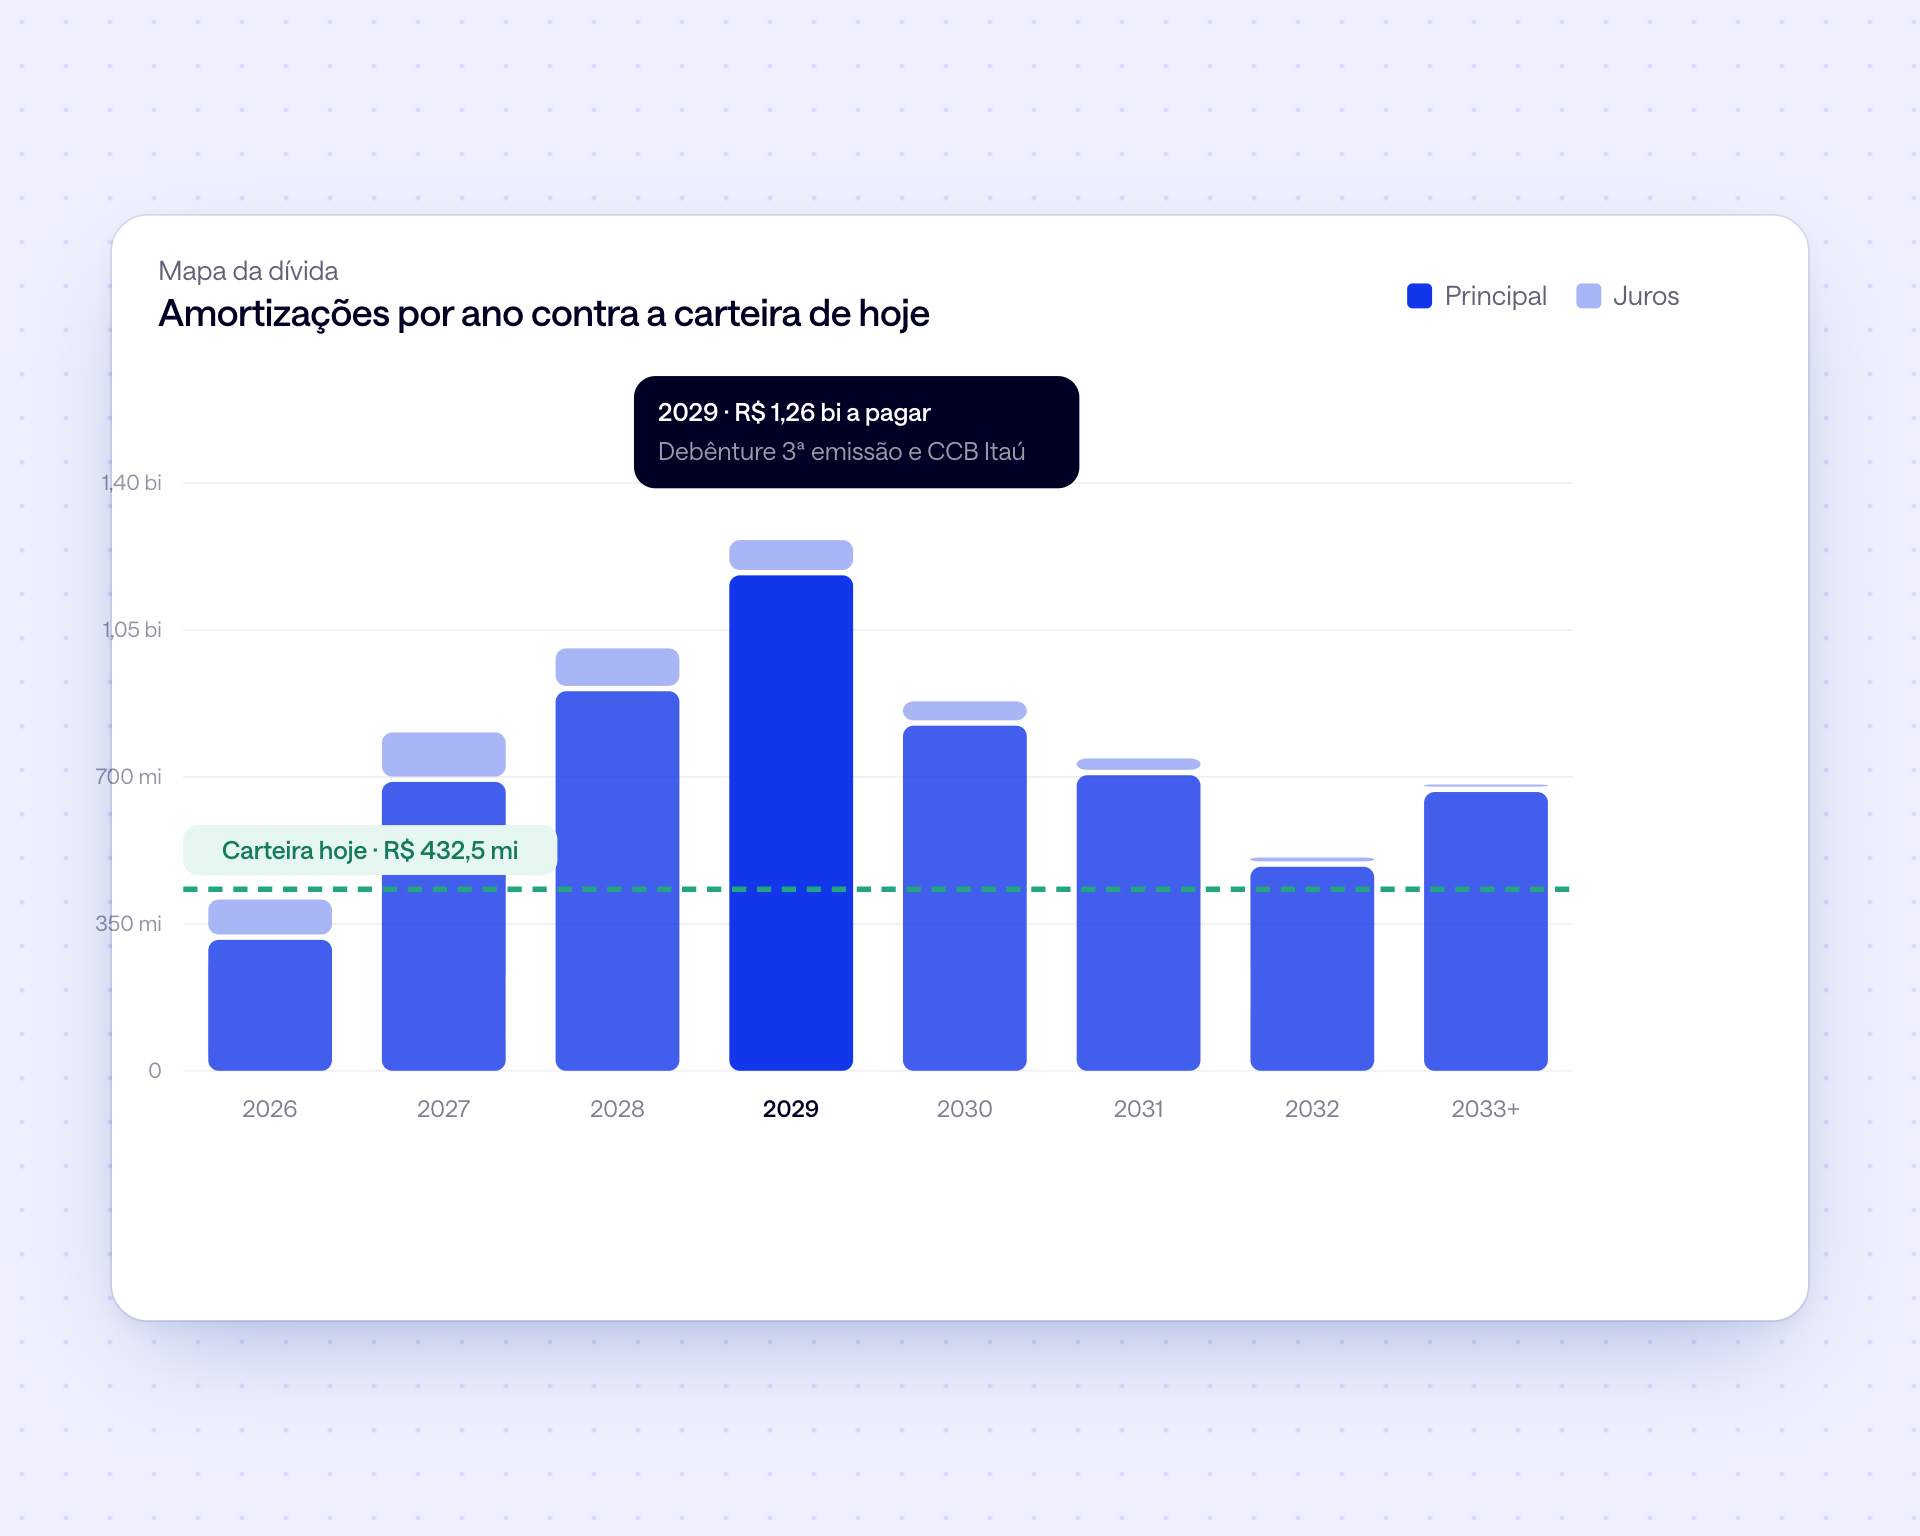
Debt map
Amortizations and interest by year against today's portfolio, with the cost of each contract and covenants tracked.
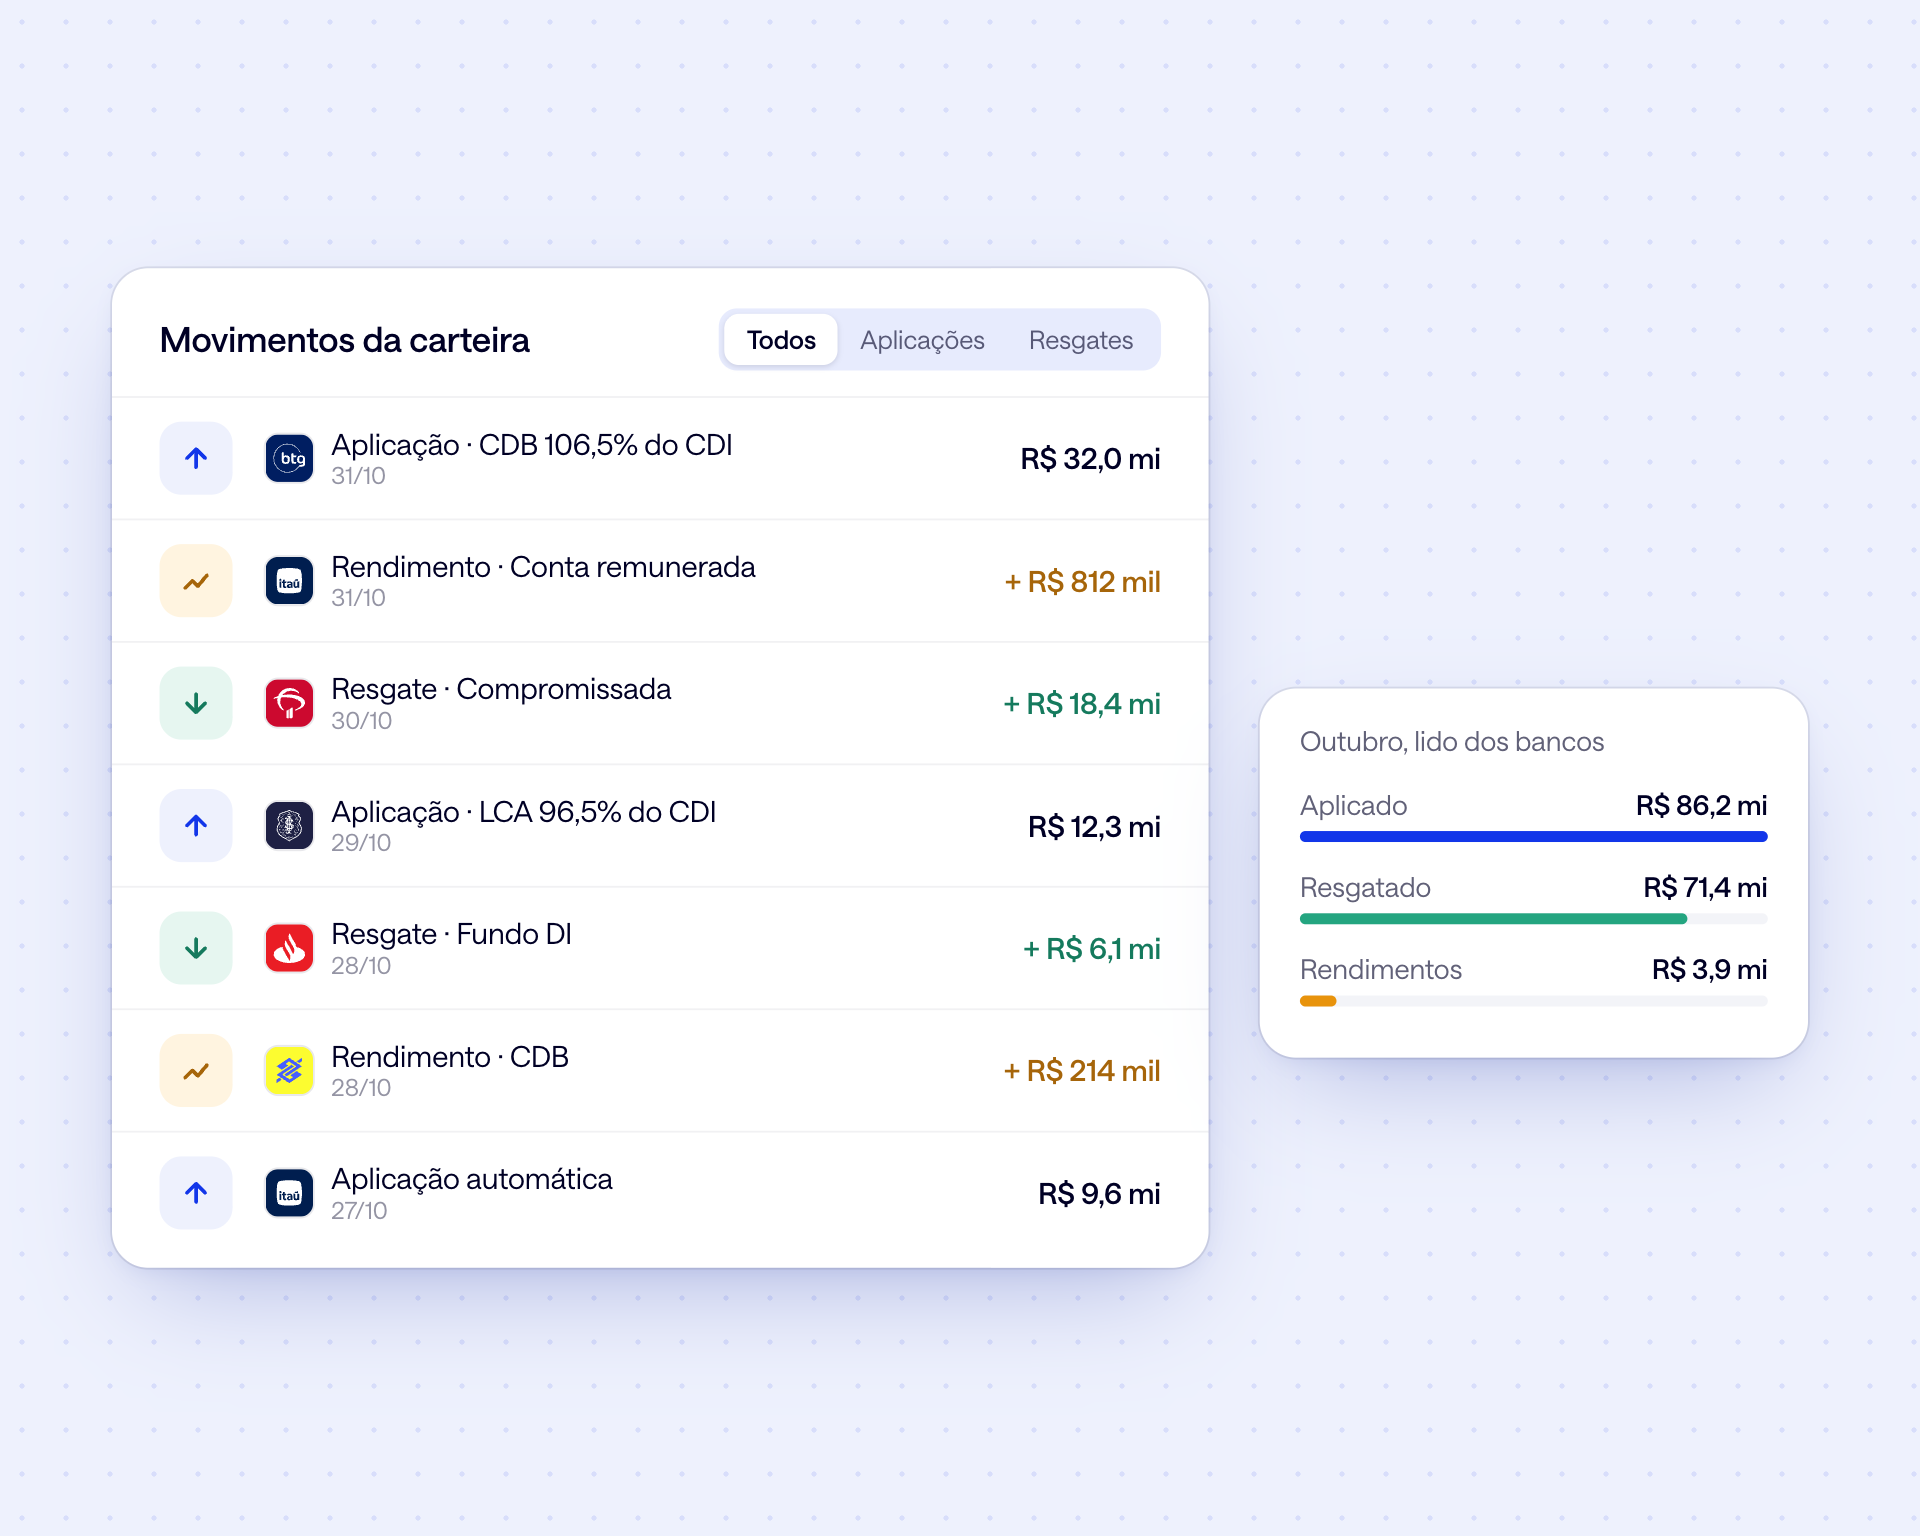
Portfolio transactions
Investments, redemptions and income read from the banks, with the rate, term and institution of each one.
What changes in practice

Whole portfolio as a % of CDI, every day
Underperforming investments highlighted
This week's maturities before you reinvest
Concentration by bank against the policy
Cost of debt next to investment returns
Transactions read from the banks, no spreadsheets
Frequently asked questions
Which instruments does the portfolio cover?

CDBs, LCIs, LCAs, repos, investment funds, government bonds, interest-bearing accounts and automatic sweep investments, from every connected bank.
How is the rate relative to CDI calculated?
Each investment's return over the period is compared with the CDI for the same period. The portfolio average is weighted by the amount invested, and you see the figure for each investment.
Can I see concentration by bank and by rating?
Yes. The portfolio is shown by institution, by instrument and by rating band, compared with the limits of your investment policy.
Do debt and portfolio use the same data?
Yes. The portfolio comes from the bank connections and the debt from the contracts registered in Debt Management, on the same dashboard and in the same reports.
Does Datanomik make investments or redemptions?
No. Datanomik reads and measures the portfolio and the debt. Investments, redemptions and funding are still done at the group's banks.
How often is the portfolio updated?
Positions and transactions are read from the banks every day, and each investment shows the date of its last update.
Ready to transform your treasury?
Fill out the form and our team will get in touch shortly.

Allan Andrade
Datanomik Treasury Manager